The Problem
Disclaimer: I am not a netcode specialist, in Unreal Engine or otherwise. I’m just going to tell you how I solved a gnarly problem I had, and why I think it happened. I may well be wrong about any of this, so I welcome all feedback about any nuances or specifics I might have missed or misunderstood, you can find me at Mastodon (preferable) and Bluesky.
We’re working on a multiplayer game in UE5, and last week something weird started happening. All of a sudden we had a 45 second period where property replication just….stopped. The server had changed values, but it wasn’t sending them out to anyone during that time. It wasn’t even trying! Then after that time was up, it all jumped back to life again.
Here’s what the network profiler had to say (Unreal Insights was similar):
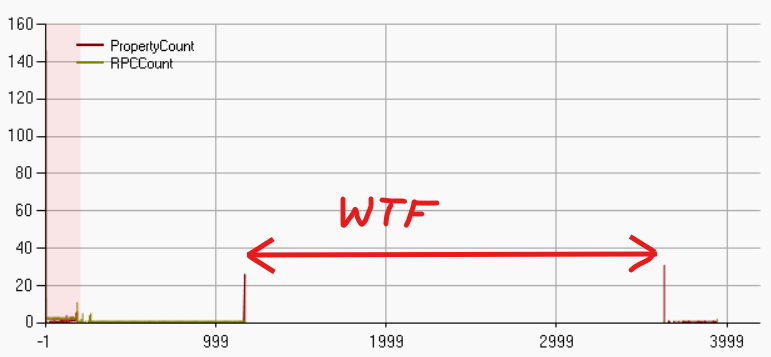
Absolutely nothing is happening in that time window. No RPCs, no property replication, nothing. Why? How do you figure out what’s causing it? Let’s start with a bit of background.
The Setup
Our game is pretty standard multiplayer fare in that you start in a lobby, then all depart on a mission together. In our case we send a simplified version of the data required to build the level to all players. Our levels are modifiable, so we can’t just generate them deterministically at the client end based on a seed, because you’d never be able to have late joiners (you can only generate the starting state of the level from a seed).
So, in order to send this data down to clients we have to use RPCs - properties can’t really do it. We chop the data up into chunks that won’t blow the RPC limits and have clients tell us when they’ve processed it. You can read more about this technique on Alvaro Jover-Alvarez’s blog. Importantly, these are all reliable RPCs - they have to be. It’s only during loading / travelling to the mission so it shouldn’t be a big deal, right? (foreshadowing)
Once all clients have finished processing the level the server gives the green light and spawns everyone into their starting positions. And that seemed fine, until we started testing with larger levels.
With larger levels, we’d get the RPCs back from clients saying everyone is ready, and the server would spawn everyone in, the clients would carry on displaying the loading screen for up to a minute. On the server end, everything was there and nothing really was happening. But none of the pawns were replicated, nor were any of the global GameState changes (which ruled out network relevancy).
Exploring via Logging
At first it was a struggle to get anything out of the logs. I had assumed that LogRep and LogRepTraffic would be
the log categories to watch (since the problem was property replication), but in fact those aren’t very useful. You
really want these logging settings (via the console):
Log LogNetTraffic Log
Log LogNetPackageMap Log
net.PackageMap.DebugAll 1
Once I had these enabled, this is what I saw in the log during the “dead” times:
LogNetTraffic: ServerReplicateActors_BuildConsiderList, Building ConsiderList 166.84
LogNetTraffic: Consider B_MinerGameState_C_0 alwaysrelevant 1 frequency 10.000000
LogNetTraffic: Consider B_MinerPlayerState_C_0 alwaysrelevant 1 frequency 100.000000
...
LogNetTraffic: Consider B_PlayerController_C_1 alwaysrelevant 0 frequency 100.000000
LogNetTraffic: Consider B_MinerPlayerState_C_1 alwaysrelevant 1 frequency 100.000000
LogNetTraffic: ServerReplicateActors_PrioritizeActors: Potential 0012 ConsiderList 012 FinalSortedCount
LogNetTraffic:  Saturated. Mark B_PlayerController_C_1 NetUpdateTime to be checked for next tick
LogNetTraffic:  Saturated. Mark B_MinerGameState_C_0 NetUpdateTime to be checked for next tick
LogNetTraffic:  Saturated. Mark B_MinerPlayerState_C_1 NetUpdateTime to be checked for next tick
LogNetTraffic:  Saturated. Mark B_MinerPlayerState_C_0 NetUpdateTime to be checked for next tick
...
Clearly it was considering these actors for replication, but thought that the connection was “saturated”. But there was nothing going on in these 45-60 seconds, all my RPCs had finished. So what was gumming up the works for all this time afterwards??
Hacky Workaround
One thing you can do to prove that your problem is that UE thinks the network is saturated is set this console option:
net.DisableBandwithThrottling 1
If your problems go away with that setting, you’ve hit the same problem I did. You can’t use that setting in Shipping builds though, so don’t rely on it.
Saturated? More like slightly damp
The thing is, “saturated” doesn’t really mean what you think it means. It sounds like you’ve clogged the system up royally! But “saturated” actually means “there’s anything in the pipe at all”. Let’s dig in.
The function UNetDriver::ServerReplicateActors_ProcessPrioritizedActorsRange processes the sorted list of Actors that
want to replicate this tick. You can see the input to this function in the log message:
ServerReplicateActors_PrioritizeActors: Potential 0012 ConsiderList 012 FinalSortedCount
To clarify, ServerReplicateActors_PrioritizeActors is the function which orders the Actors by priority, and passes the result to
the function ServerReplicateActors_ProcessPrioritizedActorsRange for final filtering. Anyway, the latter function does this right
at the top:
if (!Connection->IsNetReady( 0 ) && !bIgnoreSaturation)
{
    GNumSaturatedConnections++;
    // Connection saturated, don't process any actors
    return 0;
}
bIgnoreSaturation is always false. This one IsNetReady call is basically nixing our entire replication tick. But why? We’re not doing anything right now!
The key is that IsNetReady is pretty restrictive. It basically boils down to this:
return QueuedBits + SendBuffer.GetNumBits() <= 0;
This means that if there’s anything queued from previous ticks (or anything in this tick’s buffer already), the entire replication tick just aborts. That’s a pretty harsh limitation, but for replication it’s kinda fine because all Actors are considered just once together in the tick.
But, the sharp eyed might be going “aaahhh” because - what if you’ve already queued a reliable RPC this tick? That’s right,
it having queued stuff up on the connection will totally stop replication happening this tick. Reliable RPCs get
priority, and even if the data they queue up in no way saturates the connection, it doesn’t matter. Anything will
fail this IsNetReady test (I believe).
This is one reason why you’re told not to send reliable RPCs every tick. Some things in the engine send unreliable RPCs every tick, like character movement components, but those get queued up instead of taking priority over property replication
Compounding The Problem
On its own this doesn’t seem like the cause. Surely this would only create temporary pauses in the property replication while the bulk RPCs are being called, then it should catch up immediately afterwards, right? Right? (Padme meme)
Unfortunately no. Some of the changes I make while the RPCs are happening themselves generate property changes, and for
reasons I don’t entirely understand, UE seems to queue up a whole bunch of data on the UNetConnection when you try to
do too much at once, then slowly bleeds it down again once the peak has passed. Remember that QueuedBits property
on UNetConnection? Let’s see what it does if you spam RPCs down the pipe every tick, with a little bit of debug logging.
// I put this in my GameState tick
for (auto& Player : PlayerArray)
{
    if (IsValid(Player))
    {
        if (auto PC = Player->GetPlayerController())
        {
            if (!PC->IsLocalPlayerController())
            {
                if (auto Conn = PC->GetNetConnection())
                {
                    FNetConnectionSaturationAnalytics Analytics;
                    Conn->ConsumeSaturationAnalytics(Analytics);
                    UE_LOG(LogTemp, Log, TEXT("%s: Connection queued bits: %d    Saturated Replications: %d"), *Player->GetPlayerName(), Conn->QueuedBits, Analytics.GetNumberOfSaturatedReplications());
                }
            }
        }
    }
}
Now this is what the output looks like when I spam reliable RPCs every frame (but still within the limit of the RPC queue):
LogTemp: Sinbad-WorkPC-C0387E: Connection queued bits: -26666    Saturated Replications: 0
LogTemp: Sinbad-WorkPC-C0387E: Connection queued bits: -26666    Saturated Replications: 0
LogTemp: Sinbad-WorkPC-C0387E: Connection queued bits: 2165318    Saturated Replications: 0
LogTemp: Sinbad-WorkPC-C0387E: Connection queued bits: 2155689    Saturated Replications: 1
LogTemp: Sinbad-WorkPC-C0387E: Connection queued bits: 2142660    Saturated Replications: 1
LogTemp: Sinbad-WorkPC-C0387E: Connection queued bits: 4050047    Saturated Replications: 1
...
LogTemp: Sinbad-WorkPC-C0387E: Connection queued bits: 9018396    Saturated Replications: 1
LogTemp: Sinbad-WorkPC-C0387E: Connection queued bits: 10190311    Saturated Replications: 1
...
LogTemp: Sinbad-WorkPC-C0387E: Connection queued bits: 12096015    Saturated Replications: 1
LogTemp: Sinbad-WorkPC-C0387E: Connection queued bits: 12086386    Saturated Replications: 1
...
Yeah “queued bits” keeps going up. I have no idea where those numbers are even coming from - my RPCs have a max of 32K
data (262,144 bits) and are being fully processed. I’m not issuing all of them in one tick, they’re spread out and being
processed as they go, there’s no reason to think they’re backing up. I’m even getting the responses back. But something is
adding numbers to QueuedBits and making UE think it has a shit ton of things left to process.
Once I’m done with my RPCs, this QueuedBits value is extremely high and only reduces by a tiny amount every tick after
that. It takes 45 seconds to clear, at which point property replication resumes. But it’s important to note that absolutely
nothing gets sent during those 45 seconds; but UE thinks it’s doing something because it drains the QueuedBits value.
In general QueuedBits puzzles me; it seems more like an estimate than an actual record of activity.
The Solution
The solution I found, or rather a workaround, is to space out my RPCs more. Not just by waiting a bit, say by only calling them every 10 ticks or something - I found this actually made things worse, because now my code is idling and I can still hit a bunch of frames where UE wants to replicate something and create the same issue.
Instead, I monitor the UNetConnection myself, and delay my own RPCs whenever it seems busy. Because although I need
my RPCs to be reliable, I don’t need them to take priority, particularly over replication. So I did this:
if (Conn && !Conn->IsNetReady(false))
{
    // Try to avoid saturating network connection
    // If we don't do this, replication will get backed up really badly and clients
    // will be waiting for ages after server has entered level
    UE_LOG(LogMiner, VeryVerbose, TEXT("SERVER: Delaying sending map to %s until network connection is clear"), *Task.Player->GetPlayerName())
    break;
}
Once I did that, all my problems went away. UE still occasionally complains about saturation; I believe I could get rid of that by making my tick that runs this code run after the network tick, but importantly this does not delay any replication after the RPCs are done. Now, once my bulk level transfer RPCs are finished, replication immediately resumes again. Phew.
And look at my QueuedBits logging:
LogTemp: Connection queued bits: 198674    Saturated Replications: 1
LogTemp: Connection queued bits: 185645    Saturated Replications: 1
LogTemp: Connection queued bits: 120500    Saturated Replications: 1
LogTemp: Connection queued bits: 107471    Saturated Replications: 1
LogTemp: Connection queued bits: 55355    Saturated Replications: 1
LogTemp: Connection queued bits: 42326    Saturated Replications: 1
LogTemp: Connection queued bits: 29297    Saturated Replications: 1
LogTemp: Connection queued bits: 16268    Saturated Replications: 1
LogTemp: Connection queued bits: 3239    Saturated Replications: 1
LogTemp: Connection queued bits: -9790    Saturated Replications: 1
LogTemp: Connection queued bits: 238200    Saturated Replications: 2
LogTemp: Connection queued bits: 176463    Saturated Replications: 1
See how the QueuedBits is bouncing up and down as you’d expect? Much more healthy, and also why property replication
resumes straight after - there’s nothing to drain down afterwards.
It’s also important to realise that the RPC part of my code is no slower than before. It’s not like I’m suddenly spreading
them out over a much longer period. I’m just skipping ticks where it looks like something is going on, but I still get to RPC
most ticks. Some degenerate condition happens when I try to do it arbitrarily (even with spacing) whcih compounds into
a runaway QueuedBits which impacts replication for ages after I’m done unless I use this workaround.
If anyone understands more about this, I’d love to hear about it!
Update 13th May 2025
Thanks to Riley Labreque who suggested some DefaultEngine.ini changes based on Fortnite:
[/Script/Engine.Player]
; rlabrecque - By default these are set to 100000 - Fortnite and Lyra have this set to 200000
; Increased to raise the netload we can output before we start dropping unreliable RPCs
; https://udn.unrealengine.com/s/article/Replicating-Large-Arrays-and-Data-Sets
; https://udn.unrealengine.com/s/question/0D54z00007JuF1iCAF/replicated-properties-stop-syncing-on-the-client-after-a-few-seconds
ConfiguredInternetSpeed=200000
ConfiguredLanSpeed=200000

[/Script/OnlineSubsystemUtils.IpNetDriver]
MaxClientRate=200000
MaxInternetClientRate=200000

[/Script/Engine.GameNetworkManager]
; Match ConfiguredInternetSpeed above.
TotalNetBandwidth=200000
; rlabrecque - These are taken from Lyra, presumably this needs to be updated in lockstep with TotalNetBandwidth.
; I.E. If we halved TotalNetBandwidth, then we probably want to halve these?
MaxDynamicBandwidth=40000
MinDynamicBandwidth=20000
I found that applying these changes without my workaround did not eliminate the property replication delay, but it
did reduce it by about half (20s instead of 45s). The QueuedBits count didn’t go anywhere near as high, but was still
very high once all the RPCs were done, and took that 20s to reduce back to 0.
However, when combined with my workaround, it reduced the time it took for the map sync RPCs to complete by half, while still eliminating the property replication delay. I’m still sending the same number of RPCs with the same data size, but clearly with that change there are more “gaps” in which to send them. So overall this combination is the best solution I have as of today.
I really need to try to get access to UDN, it clearly has a lot of useful info not available on the open web. 🤔